VAST-2019-MC1
An analytical solution proposed to save a city from disaster and manage and organize the city's limited resources in a decisive way.
Disaster Management Analysis
VAST 2019 - MC 1 - Rescuing St. Himark
A visual analytics approach to solve a crisis management problem and address issues reported in St. Himark.
Problem Statement
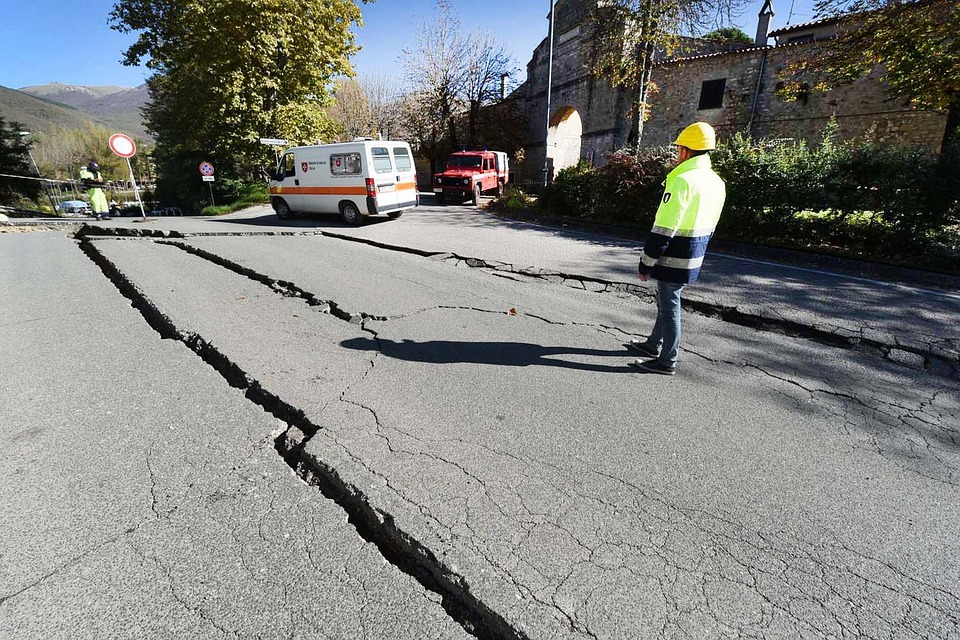
St. Himark has been hit by an earthquake, leaving officials scrambling to determine the extent of the damage and dispatch limited resources to the areas in most need. They quickly receive seismic readings and use those for an initial deployment but realize they need more information to make sure they have a realistic understanding of the true conditions throughout the city.
In a prescient move of community engagement, the city had released a new damage reporting mobile application shortly before the earthquake. This app allows citizens to provide more timely information to the city to help them understand damage and prioritize their response. In this mini-challenge, use app responses in conjunction with shake maps of the earthquake strength to identify areas of concern and advise emergency planners. Note: the shake maps are from April 6 and April 8 respectively.
With emergency services stretched thin, officials are relying on citizens to provide them with much needed information about the effects of the quake to help focus recovery efforts.
By combining seismic readings of the quake, responses from the app, and background knowledge of the city, help the city triage their efforts for rescue and recovery.
Analysis
The following are temporal radar plots that have the magnitude of shake intensity or damage on the radial scale and time-scale on their circumferential path.
Radar plots can enhance the quality of analysis by showing not just the variations of magnitude over time, but also giving knowledge about the history of the incident. A simple time-series analysis of a radar plot is shown below.

For example, Southton had a massive quake from 01:00 to 02:00 and everything was calm and settled after the hour. But after a while, when Terrapin Springs is in a critical state and in desperate need of emergency services, Southton could pitch in and help those in need since it doesn’t need as much attention at the moment as Terrapin Springs.

Documentation
This repo has all project files for the analysis of the VAST 2019 - Mini Challenge 1. For quick navigation, use the following links: